Tag Archives: Emily Ruth Cannon
Porch Season
Welcome to summer, or as I like to call it “Porch Season”. What’s that you say? Too hot for porches in summer? Absolutely not. And just to prove it, we have two new listings with fabulous front porches that will be cool regardless of the temperature outside.
The first is 115 N Clinton Ave, which will be available Monday. Check out that cute as can be swing and the artful arches. I can just see you, sitting there with your cold beverage of choice, enjoying the summer breezes. Simply fabulous!
The second is 822 Stewart Dr. This wonderful Tudor has a north-facing porch, and mature trees, so the whole thing is kept out of direct sun. And the porch is extra long so you can invite some buddies over to share in your coolness. Double points to this home for also having a pool.
So happy Porch Season, y’all. And if you need a porch, we’ve got one for you.
XO
J
Client Highlight: Jenn before and after photos
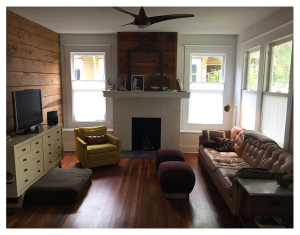
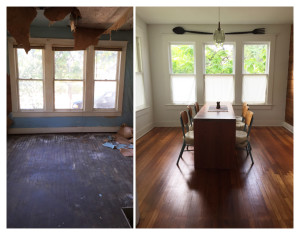
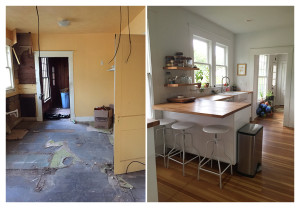
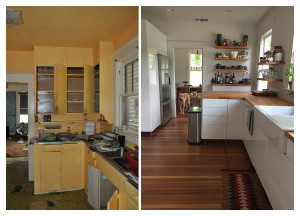
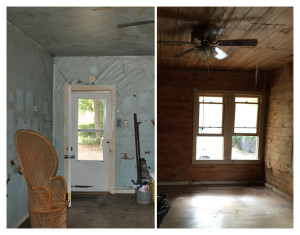
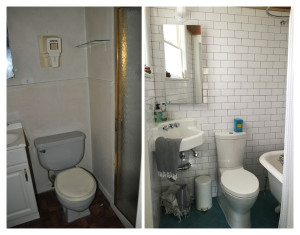
Sometimes I wonder why people trust me. Have a look at these “before” photos. My friend and client Jenn actually bought this house, in this condition, after I made her leave work immediately to see it. We could easily say that Jenn has vision! To verify, just look at the “after” photos.
Great stuff right?
How did we do that?
For starters, Jenn was really clear about what she wanted in a house. She told me her size, price and location criteria. She also wanted a place in which she could insert her own personal style. Together, we were aware that she would likely have to buy a fixer upper. Through my experience, I had ballpark knowledge of what her renovation might cost, as well as deep neighborhood insight on “fixed-up” pricing. So, when I saw her future home, I wasted no time in getting her in quickly.
Additionally, Jenn had done her financing homework, and was connected with a great lender (thank you Jerrett Morris). He got her a loan with home improvement budget, and then helped walk her through the complex process. Though the renovation took several months, many contractors, and a ton of personal time, she is now happily at home.
Thanks for trusting me, Jenn. Teamwork makes the dream work, baby.
How’s the Market?
I get asked this question on an almost daily basis. As in how is the Real Estate Market. I know that I feel busy. But being a data geek, I always have to cross-check my "feelings" with actual information from MLS. Keep in mind that what is sold in MLS represents many, but not all homes sold. It’s just the best global yardstick we have to measure with.
But how do we determine what the sold data means? Point2.com (a Real Estate blog) says this:
Months of inventory are often referenced when determining whether it’s a seller’s market or a buyer’s market:
- If there are 0-4 months of inventory, meaning that all current listings can expect to be sold within 4 months, it is considered a seller’s market because houses are selling very quickly. In a seller’s market, sellers have the advantage because demand for property exceeds supply.
- If there are 5-8 months of inventory, it is considered a balanced market. Current listings aren’t selling like hotcakes, but they’re not staying on the market too long either.
- If there are 9 or more months of inventory, it is considered a buyer’s market because houses are selling slowly. In a buyer’s market, buyers have more negotiating power than sellers do because the supply of listings exceeds the current demand for housing.
These timelines are approximate, but it is generally accepted than fewer than 6 months of inventory reflects good conditions for sellers whereas greater than 6 months of inventory represents optimum conditions for buyers.
Ok…so what does my immediate market area look like? Well for Oak Cliff (north of Clarendon St), there is less than 4 months supply of homes across all price points and types. Including condos and townhomes. I even went so far as to break it down by price ranges. To my shock some ranges have less than one month’s supply. Here’s the data:
| price range | sold* | active | supply |
| all resid. | 124 | 53 | 2.56 |
| <$100k | 10 | 1 | 0.60 |
| $100-200 | 31 | 5 | 0.97 |
| $200-300 | 20 | 9 | 2.70 |
| $300-400 | 17 | 8 | 2.82 |
| $400-500 | 14 | 10 | 4.29 |
| $500-700 | 14 | 5 | 2.14 |
| >$700k | 10 | 1 | 0.60 |
*sold in the last six months
What does this all mean? Well to me, it explains why it feels busy. My seller clients are getting multiple offers on their homes. My buyer clients are running around trying to see properties the moment they come on market. One tough reality of this is that more homes could be sold if there were more available. In fact, NAR wrote a recent report stating that homes sales went DOWN in January specifically because of the lack of inventory.
If you’re thinking of a move, now could be an ideal time to sell. Your home is at a premium. And if you’re interested in this type of information for your specific neighborhood, let me know. We data geeks love this stuff!
XO
J

